Downloads
Download


This work is licensed under a Creative Commons Attribution 4.0 International License.
Article
Evaluation of Measurement Uncertainty of Net Power of Automobile Engine
Xi Chen *, Wei Zheng, Kan Wang, Kaiji Gong, and Jun Yang
Power System Laboratory, Xiangyang Daan Automobile Test Center Limited Corporation, High-Tech Zone, Xiangyang 441004, China
* Correspondence: chenxi@nast.com.cn; Tel.: +86-13607275969
Received: 30 September 2024; Revised: 13 February 2025; Accepted: 18 March 2025; Published: 20 March 2025
Abstract: The net power of an automobile engine is one of the important indicators for measuring engine performance, which reflects the power output capacity of the engine under actual working conditions. In this paper, a natural gas engine is selected. Based on the test procedure and measurement method, a mathematical model of net power is established. The standard uncertainties of parameters such as measurement repeatability, measured engine torque, measured engine speed, atmospheric pressure, intake humidity, and intake temperature in the model are analyzed. Finally, the evaluation result of measurement uncertainty of net power is obtained.
Keywords:
automobile engine net power mathematical model evaluation of measurement uncertainty1. Introduction
The net power of the engine is one of the important indicators for measuring engine performance, which reflects the power output capacity of the engine under actual working conditions. When the engine undergoes product type certification, it is necessary to detect the net power in accordance with GB/T 17692-1999 “Test Method for Net Power of Automobile Engines” and evaluate the measurement uncertainty of the measurement results [1]. According to the evaluation results, it is judged whether the standard limit requirements are met. In order to evaluate the test results of the net power of automobile engines more accurately, the measurement uncertainty of net power is evaluated in accordance with the following standard requirements: GB/T 17692-1999 “Test Method for Net Power of Automobile Engines” [2], JJF1059.1-2012 “Evaluation and Expression of Measurement Uncertainty” [3], CNAS-CL01-G003:2018 “Requirements for Measurement Uncertainty” [4], CNAS-GL023:2018 “Measurement Uncertainty Evaluation Guidelines and Examples of Typical Parameters in the Automotive and Motorcycle Inspection Field” [5].
2. Test Sample and Test Equipment
The sample used in this test is a China VI gas engine. The main parameters are shown in Table 1. The instruments and equipment used are all within the calibration validity period and have passed conformity determination. The specific information is shown in Table 2.
| Item | Parameter |
|---|---|
| Working principle | Spark ignition |
| Item | Parameter |
| Engine displacement | 14.8 L |
| Maximum net power/speed | 413 kW/1700 r/min |
| Maximum net torque/speed | 2722 Nm/1050~1350 r/min |
| Intake method | Turbocharging |
| Test Instrument | Maximum Allowable Error |
|---|---|
| Dynamometer |
Speed: ±0.1% FS Torque: ±0.2% FS |
| Intake temperature sensor | ±1 ℃ |
| Atmospheric pressure gauge | ±0.05 kPa |
| Hygrometer |
(0–90) %RH: ±2% FS (91–100) %RH: ±3% FS |
3. Analysis of Influencing Factors and Determination of Evaluation Methods
3.1. Evaluation Method of Measurement Uncertainty
Measurement uncertainty is generally composed of several components. Some components can be evaluated according to the statistical distribution of a series of measured values and evaluated according to Class A evaluation of measurement uncertainty and can be characterized by standard deviation. While other components can be evaluated according to the probability density function obtained based on experience or other information and evaluated according to Class B evaluation of measurement uncertainty, also characterized by standard deviation. See Table 3.
| Evaluation Category | Definition | Calculation Method | Source |
|---|---|---|---|
| Class A | Evaluation of measurement uncertainty components by statistical analysis of measured values under specified measurement conditions | Calculate standard deviation according to Bessel’s formula | Used for detection with more measurement times. |
| Calculate standard deviation according to range method | Used for detection with fewer measurement times. | ||
| Class B | Evaluation of measurement uncertainty components by methods different from Class A evaluation of measurement uncertainty | Calculate the standard deviation according to different distribution types. | Manufacturing instructions for instruments and equipment, metrological characteristics (provided by verification or calibration certificates), and reference data provided in technical manuals. |
According to the estimation of probability distribution in Appendix B of JJF1059.1, the following probability density distribution types are mainly considered in the uncertainty evaluation in the engine detection field:
(1) Normal distribution (Gaussian distribution);
(2) Rectangular (uniform) distribution: Class B uncertainty caused by the maximum allowable error of the measuring instrument;
(3) Triangular distribution: Class B uncertainty caused by the maximum allowable error of the measuring cup.
As a comprehensive test item, net power has many factors affecting its test results. According to its calculation formula (detailed introduction in the mathematical model below), it can be known that the measurement result of net power is directly related to engine torque, engine speed, intake temperature, intake humidity, and atmospheric pressure.
3.2. Influence of Dynamometer and Measurement and Control System
Engine speed and torque are measured by the dynamometer and measurement and control system and directly participate in the result calculation. According to the dynamometer speed and torque measurement device instruction manual, Class B evaluation is adopted.
3.2.1. Influence of Power Correction Coefficient
To obtain the power of the engine under standard atmospheric conditions, power correction is also required. At this time, three parameters of atmospheric pressure, intake temperature, and intake humidity are required. These three parameters calculate the power correction coefficient through an empirical formula. According to the instruction manual of the corresponding sensor on the bench, Class B evaluation is adopted.
3.2.2. Influence of Measurement Repeatability
If the uncertainty evaluation is only carried out based on the calculation formula of the measurement result, some measurement uncertainty components may be omitted. Although some input quantities have an impact on the measurement result, due to insufficient information, the magnitude of their impact on the measurement result cannot be quantitatively calculated. These input quantities will not appear in the calculation formula of the measurement result, but their impact on the measurement uncertainty of the measurement result must be considered. The influence caused by these input quantities is uniformly attributed to the repeatability factor of the output quantity. It is not necessary to evaluate the uncertainty components introduced by the measurement repeatability of each input quantity separately, but only evaluate the uncertainty components introduced by the measurement repeatability of the output quantity, and adopt Class A evaluation [6].
(a) Influence of personnel operation
In the net power test process, generally, the test personnel manually take data points. The stabilization time and measurement time of each speed will affect the test result. In this test, the same test personnel, according to the same standard operation procedure, use the test equipment in the same laboratory to test the same tested sample.
(b) Influence of bench control system
If the intake resistance is too large, the intake air volume of the engine will decrease, and the fuel injected into the combustion chamber cannot be completely burned, resulting in deterioration of engine combustion and reduction of power. During the test, the intake resistance is controlled within ±0.1 kPa of the manufacturer’s specified value according to the standard requirements.
An increase in exhaust back pressure will increase the pumping loss, resulting in an increase in mechanical power consumption and a reduction in mechanical efficiency. At the same time, excessive back pressure will increase the residual exhaust gas coefficient, resulting in incomplete combustion, reduced combustion work, and reduced engine power [7]. During the test, the exhaust back pressure is controlled within ±1 kPa of the 45 manufacturer’s specified value according to the standard requirements.
The post-intercooler temperature has an indirect impact on power. The cooled gas density increases, increasing the charge volume in the cylinder. Under the same fuel supply, the oxygen content in the combustion chamber and the compression ratio of the mixture are increased, thereby improving combustion efficiency and output power. During the test, the post-intercooler temperature is controlled within ±2 ℃ of the manufacturer’s specified value.
An increase in the pressure difference before and after the intercooler will reduce the pressure after the intercooler and the air pressure in the intake manifold, reducing the intake air volume and incomplete fuel combustion, resulting in a reduction in engine power [8]. During the test, the pressure difference before and after the intercooler is controlled within ±1 kPa of the manufacturer’s specified value.
If the coolant temperature is too high or too low, the engine power will be reduced. If the coolant temperature is too high, the heat generated by the engine cannot be removed in time, the air density entering the cylinder is reduced, and the charging coefficient is reduced, resulting in a reduction in engine power; if the coolant temperature is too low, the oil temperature will drop accordingly, the fluidity will deteriorate, the parts wear will increase, and the mechanical loss will increase, resulting in a reduction in engine power. During the test, the coolant temperature at the engine outlet is controlled at 80 ± 5 ℃ according to the standard requirements.
(c) Influence of fuel characteristics
The calorific value of natural gas fuel directly affects the performance of the engine. The natural gas reference fuels meeting the China VI standard are divided into GR, G20, G23, and G25. The components and proportions of combustible gases (methane, ethane) and inert gases (nitrogen) in different reference fuels are different, and these differences will affect the combustion of the mixture and indirectly affect the power of the engine [9].
(d) Influence of tested sample
In addition to the uncertainty of the test system, the tested sample also has uncertainty. For example, if the representativeness of sampling is not sufficient, the tested sample may not fully represent the defined measured quantity. Therefore, in actual tests, it is necessary to control the boundary conditions well and minimize the uncertainty of the sample itself. In summary, the causal relationship diagram of measurement uncertainty of net power is shown in Figure 1.
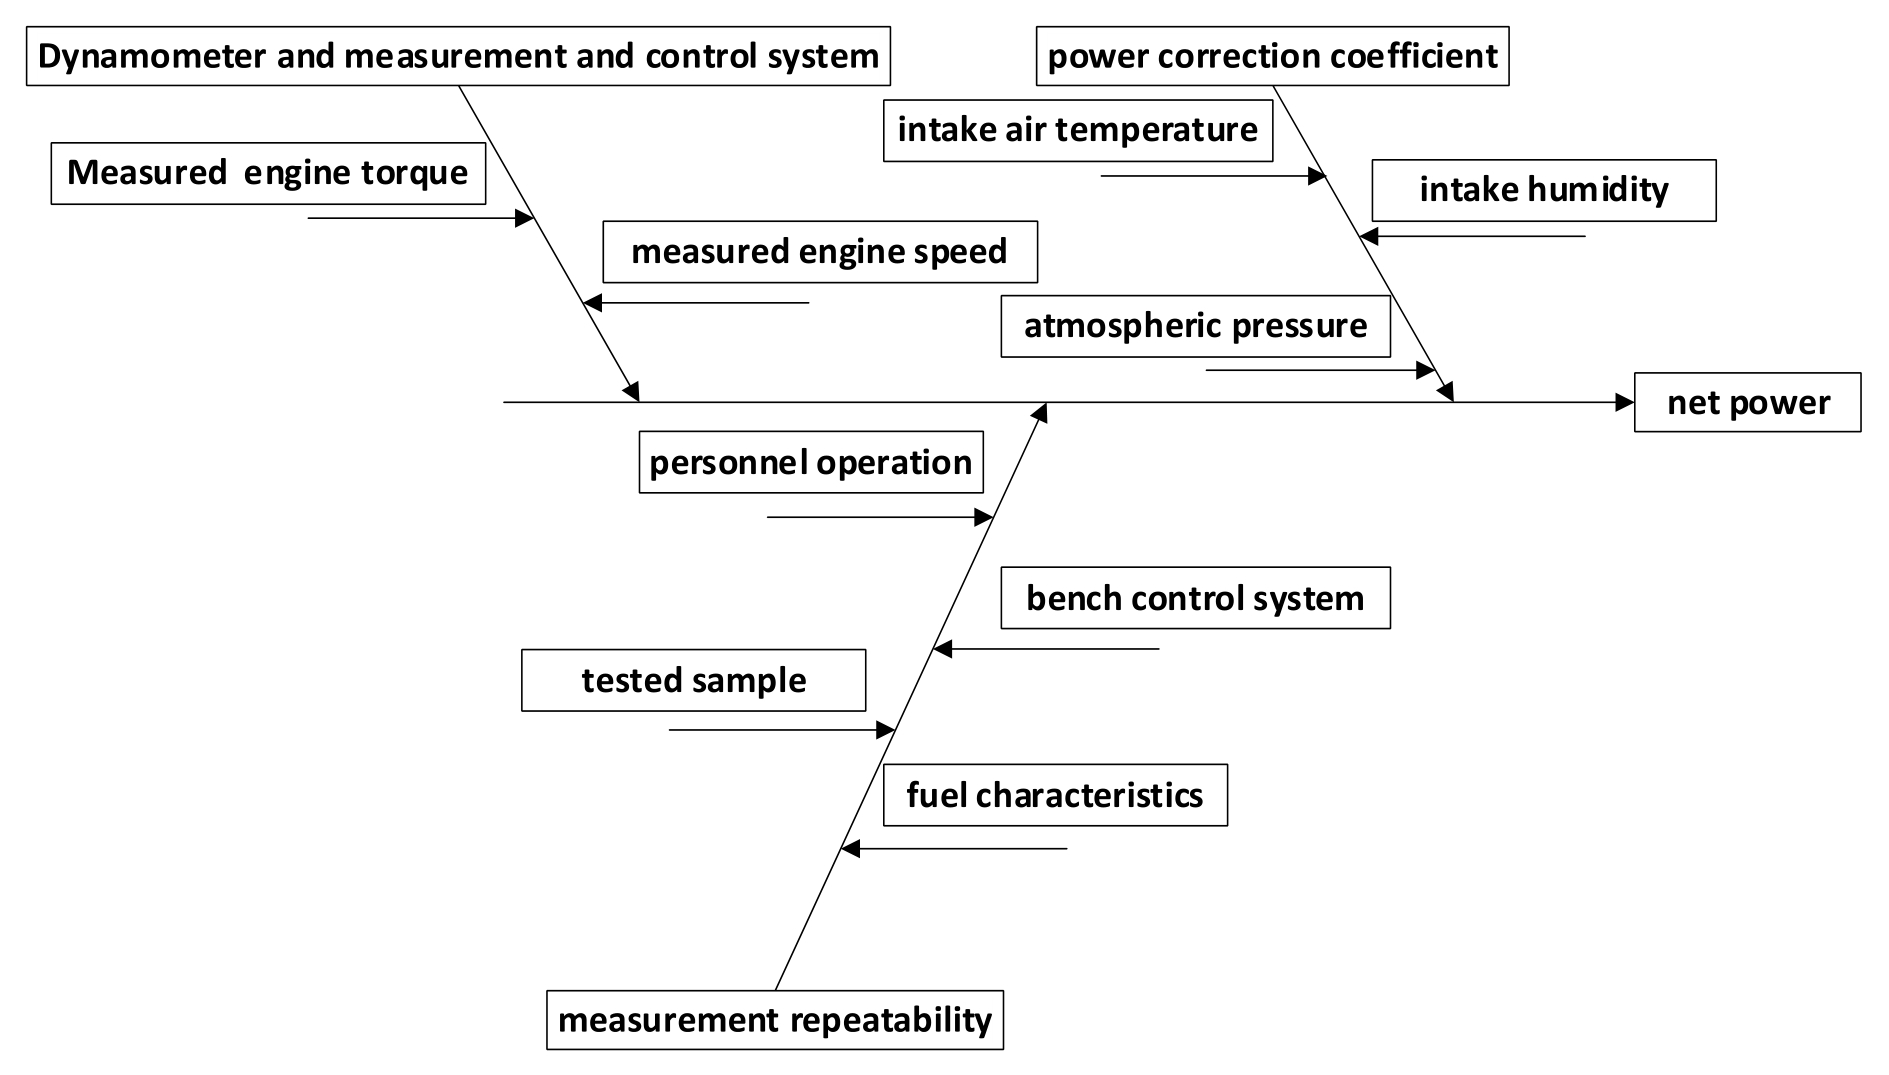
Figure 1. Causal relationship diagram of measurement uncertainty of net power.
Summarize the sources of uncertainty of the output quantity net power as shown in Table 4 below.
| No. | Source of Uncertainty | Symbol | Type | Probability Distribution | Coverage Factor |
|---|---|---|---|---|---|
| 1 | Standard uncertainty introduced by measurement repeatability | u(f1) | Class A | Normal | 1 |
| 2 | Standard uncertainty introduced by measured engine torque | u(M) | Class B | Uniform | |
| 3 | Standard uncertainty introduced by measured engine speed | u(n) | Class B | Uniform | |
| 4 | Standard uncertainty introduced by atmospheric pressure | u(pa) | Class B | Uniform | |
| 5 | Standard uncertainty introduced by intake temperature | u(T) | Class B | Uniform | |
| 6 | Standard uncertainty introduced by intake humidity | u(H) | Class B | Uniform |
4. Mathematical Model
4.1. Net Power Calculation Formula
According to GB/T 17692-1999 “Test Method for Net Power of Automobile Engines”, the calculation formula for corrected net power pe is as follows:
where:
pe—corrected net power of engine, kW;
M—output torque at the end of engine crankshaft, Nm;
n—engine speed, r/min;
α—correction coefficient;
For naturally aspirated or turbocharged spark ignition engines:
where:
ps—dry air pressure at intake, kPa;
T—intake temperature, ℃;
The dry air pressure at intake cannot be obtained directly by measurement. It is usually calculated by subtracting the water vapor partial pressure from the total pressure. The calculation formula is as follows:
where:
pa—atmospheric pressure, kPa;
pH—water vapor partial pressure at intake, kPa;
The water vapor partial pressure is related to the air humidity and the saturated vapor pressure at the corresponding temperature. The calculation formula is as follows:
where:
H—intake relative humidity, %RH
pd—saturated vapor pressure of water vapor, kPa
The saturated vapor pressure of water vapor is basically obtained by computer calculation at present. The calculation formula is as follows:
where a0, a1, a2, a3, and a4 are all constants, with values of 6.04444, 0.461236, 0.013368, 0.00025115, and 0.00000459783 respectively.
Combining Equations (1)–(5), the mathematical model of corrected net power is:
According to the uncertainty propagation law of JJF1059.1, for nonlinear functions, when u(xi) << xi, the high-order terms of the Taylor series tend to zero and can be ignored. Since intake temperature and intake relative humidity affect each other and these two input quantities are correlated, and other input quantities are uncorrelated, the combined standard uncertainty of corrected net power is:
4.2. Sensitivity Coefficient
In the evaluation of measurement uncertainty, the sensitivity coefficient represents the sensitivity of the output quantity to changes in the input quantity, and is used to transfer the uncertainty of the input quantity to the uncertainty of the output quantity. It is the partial derivative of the output quantity with respect to the input quantity. The sensitivity coefficients of each input quantity are calculated in Table 5.
| Input Quantity Sensitivity Coefficient | Sensitivity Coefficient Calculation Formula |
|---|---|
| C f 1 | Cf1 =1 |
| C M | |
| Cn | |
| C pa | |
| C T | |
| C H |
4.3. Covariance
Covariance is a measure of the interdependence between two random variables, which is the expected product of their respective errors. The covariance defined is an ideal concept under infinite measurement conditions. The covariance estimate of a single estimate of two random variables in a finite number of measurements is expressed as:
The covariance estimate of the arithmetic mean of two random variables in a finite number of measurements is expressed as:
5. Test Result Uncertainty Evaluation
According to the measurement guidelines of GB/T 17692-1999 “Test methods for net power of automotive engines”, this article only conducts a detailed calculation of the uncertainty of the test results at the maximum net power speed point. The calculation process for other speed points can be inferred by analogy.
Five tests were performed on the sample. The physical quantities related to the uncertainty of the test results and the test results are shown in Table 6 below.
| Serial Number |
Speed (r/min) |
Net Power (kW) | Net Torque (Nm) | Intake Air Temperature (℃) |
Intake Air Humidity (%) |
Atmospheric Pressure (kPa) | Power Correction Factor |
|---|---|---|---|---|---|---|---|
| 1 | 1700 | 409.1 | 2298.2 | 25.7 | 51.1 | 100.6 | 1.002 |
| 2 | 1700 | 409.0 | 2299.1 | 25.9 | 50.3 | 100.6 | 1.003 |
| 3 | 1700 | 409.3 | 2297.5 | 25.9 | 50.1 | 100.6 | 1.003 |
| 4 | 1700 | 409.5 | 2296.8 | 25.9 | 50.0 | 100.6 | 1.002 |
| 5 | 1700 | 409.6 | 2297.6 | 26.0 | 49.8 | 100.6 | 1.002 |
| Mean | 1700.0 | 409.30 | 2297.84 | 25.88 | 50.26 | 100.60 | 1.0024 |
Substitute the actual measurement data into Table 5 and Formula (9), and the calculation results are shown in Table 7 below.
| Item | Symbol | Value |
|---|---|---|
| Sensitivity coefficient | C f 1 | 1 |
| C M | 0.1785 | |
| C n | 0.2412 | |
| C pa | -4.9741 | |
| C T | 0.8281 | |
| C H | 0.1659 | |
| Covariance | -0.0107 |
5.1. Standard Uncertainty u( ) Introduced by Measurement Repeatability
The standard deviation of a single test measured value can be expressed by Bessel’s formula as:
If the average value of n measurement results is used as the estimated value of the measurement result, the standard uncertainty formula is:
In this test, each set of test results is measured only once. Therefore, the calculation formula for the standard uncertainty uA introduced by measurement repeatability is:
In this test, a total of 5 independent tests were carried out, that is, n = 5. Substituting the test results calculated from the data in Table 1 into Formula (12), the uncertainty introduced by measurement repeatability is calculated as:
5.2. Standard Uncertainty u(M) Introduced by the Measured Torque of the Engine
According to the torque flange manual of the dynamometer, the maximum allowable error of the torque flange is ±0.2% FS, the maximum measured torque is 3000 Nm, the half-width is 6 Nm. Processed as a uniform distribution and taking k = , the standard uncertainty introduced by torque is:
5.3. Standard Uncertainty u(n) Introduced by the Measured Speed of the Engine
According to the dynamometer manual, the maximum allowable error of the speed measuring device is ±0.1% FS, the maximum measured speed is 5000 r/min, the half-width is 5 r/min. Processed as a uniform distribution and taking k = , the standard uncertainty introduced by speed is:
5.4. Standard Uncertainty u(pa) Introduced by Atmospheric Pressure
According to the manual of the atmospheric pressure sensor, the maximum allowable error of the atmospheric pressure sensor is ±0.05 kPa. Processed as a uniform distribution and taking k= , the standard uncertainty introduced by atmospheric pressure is:
5.5. Standard Uncertainty u(T) Introduced by Intake Air Temperature
According to the manual of the intake air temperature sensor, the maximum allowable error of the intake air temperature sensor is ±1 ℃. Processed as a uniform distribution and taking k = , the standard uncertainty introduced by intake air temperature is:
5.6. Standard Uncertainty u(H) Introduced by Intake Air Humidity
According to the manual of the intake air humidity sensor, the maximum allowable error of the intake air humidity sensor is ±2 %RH. Processed as a uniform distribution and taking k= , the standard uncertainty introduced by intake air humidity is:
6. Evaluation of Combined Standard Uncertainty and Expanded Uncertainty
Substituting the standard uncertainty, sensitivity coefficient and covariance calculation results of each input quantity into Formula (7), the combined standard uncertainty is obtained:
Taking the coverage factor k = 2, the expanded uncertainty is:
For each source factor of uncertainty, the product of its standard uncertainty and sensitivity coefficient represents the magnitude of the influence of this factor on the combined standard uncertainty. It is represented by a bar chart in Figure 2 as follows.
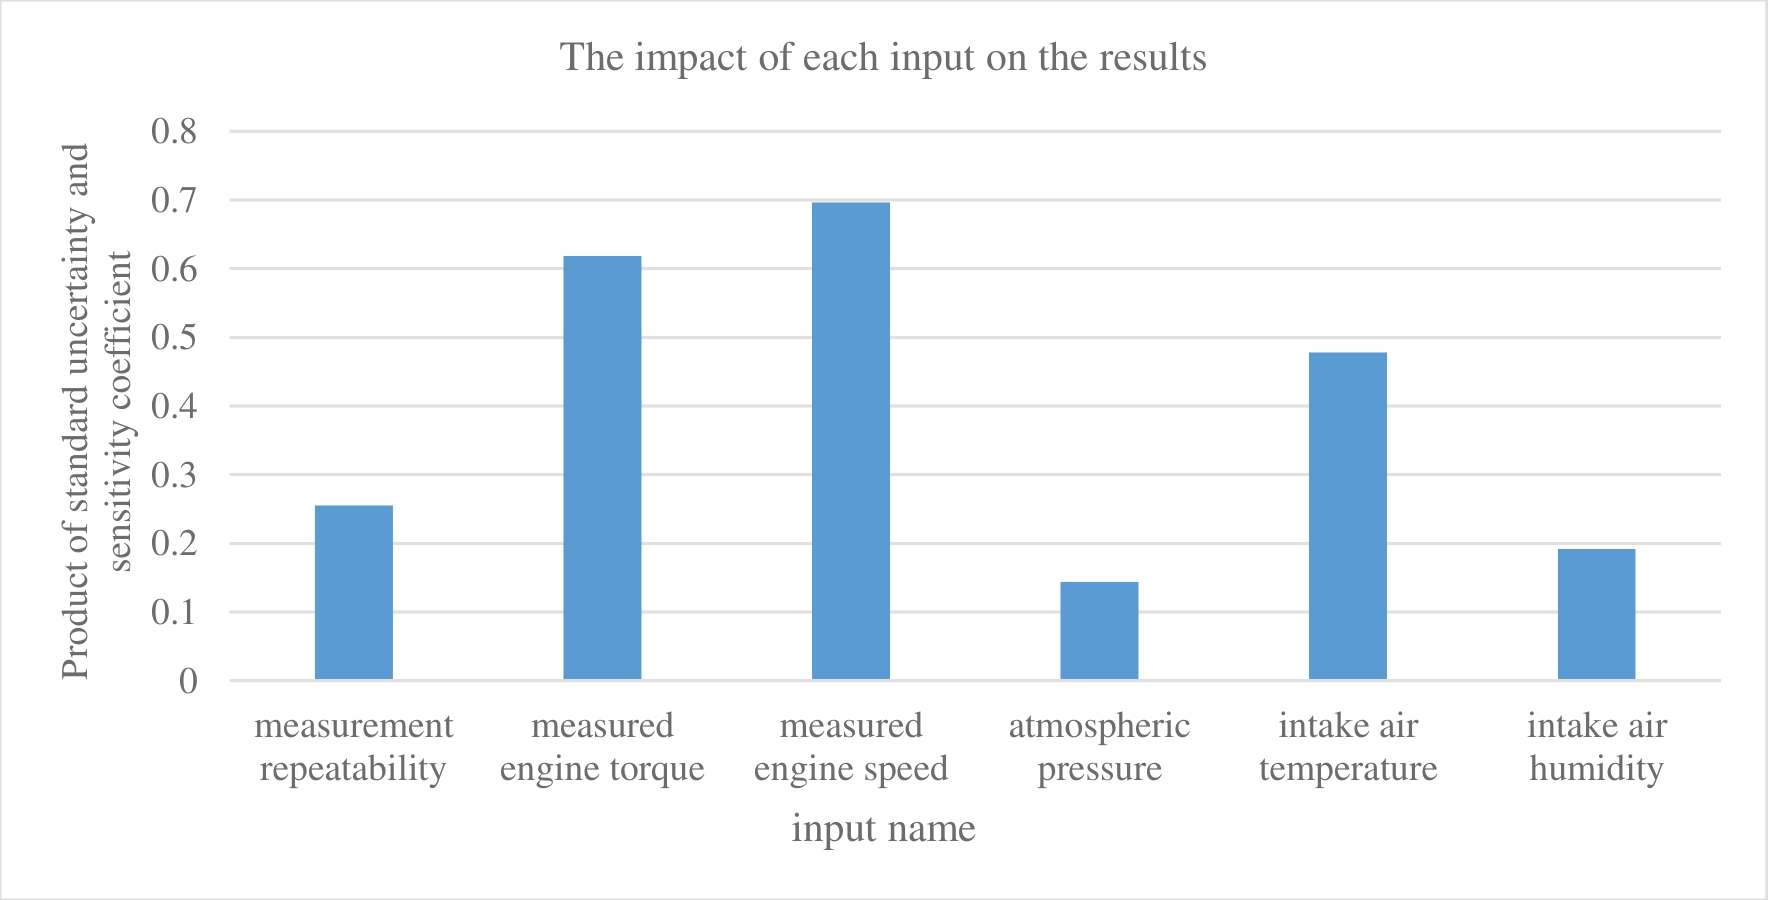
Figure 2. Influence of each input on the combined uncertainty.
7. Result Report
The corrected net power result of this net power test is pe = 409.3 ± 2.2 kW; k = 2.
8. Improvement of Uncertainty in Net Power Measurement
From the above uncertainty evaluation results, it can be seen that the main impact of the uncertainty in net power measurement is the uncertainty introduced by the three factors of engine measured speed, torque, and intake temperature. Therefore, improvements need to be made from the aspects of dynamometer and intake temperature sensor. The main measures are as follows:
For measuring the speed and torque of the dynamometer:
(1) Use high-resolution encoders and torque sensors to ensure the accuracy of signal acquisition;
(2) Optimize the installation alignment of the dynamometer and engine to reduce the interference of mechanical vibration on measurement;
(3) Keep the dynamometer and sensors working in a constant temperature environment to avoid measurement errors caused by temperature changes;
(4) Regularly clean sensors and mechanical components to avoid dust or oil contamination affecting measurement accuracy;
(5) Regularly inspect the wear of mechanical components and replace damaged parts in a timely manner.
(6) Regularly calibrate sensors to ensure their accuracy and stability.
Regarding the measurement of intake temperature:
(1) Choose thermocouple or thermistor sensors with fast response speed and high accuracy;
(2) Optimize the installation position of the sensor, install it in a location with stable airflow and uniform temperature distribution, avoid being close to heat sources (such as exhaust systems) or cold sources (such as air conditioning or fans), use insulation materials to wrap the sensor or intake duct, and reduce external heat conduction;
(3) Ensure that the temperature range of the sensor covers the actual operating requirements;
(4) Regularly calibrate sensors to ensure their measurement accuracy;
(5) Regularly check the sensors and their connecting circuits to ensure that they are not damaged or loose;
(6) Regularly clean the sensor probe to avoid dust and oil stains affecting its measurement accuracy.
9. Conclusions
Based on the actual test situation in the laboratory and in accordance with the uncertainty evaluation procedures, this paper evaluates the uncertainty of the net power result of a certain China VI gas engine, providing a reference basis for other laboratories to carry out similar uncertainty evaluations in the future. The results show that among the influencing factors, the uncertainty components introduced by the measured torque, measured speed, and intake air temperature have a greater impact on the final uncertainty value. Therefore, during the test, it is necessary to ensure that the engine is in good condition and works stably, strictly control boundary conditions such as intake air temperature, strengthen the maintenance of testing equipment, and perform regular calibration and calibration to obtain accurate and reliable test results.
Author Contributions: X.C.: writing, Coordinate modifications; W.Z.: technical guidance; K.W.: quality control; K.G.: test implementation; J.Y.: data curation. All authors have read and agreed to the published version of the manuscript.
Funding: This research received no external funding.
Institutional Review Board Statement: Not applicable.
Informed Consent Statement: Not applicable.
Data Availability Statement: Not applicable.
Conflicts of Interest: The authors declare no conflict of interest.
References
- Huang, Y.; Jiao, J.; Wang, Z.; You, Y.; Li, X. Uncertainty evaluation of CO2 emission measurement for light vehicles. Test Exp. 2021, 6, 88–92.
- GB/T 17692-1999; Net Power Test Method for Automotive Engines. The State Bureau of Quality and Technical Supervision: Beijing, China, 1999.
- JJF 1059.1-2012; Evaluation and Expression of Measurement Uncertainty. AQSIQ: Beijing, China, 2012.
- CNAS-CL01-G003:2021; Requirements for Measurement Uncertainty. CNAS: Beijing, China, 2021.
- CNAS-GL023:2018; Evaluation Guidelines and Examples of Measurement Uncertainties for Typical Parameters in The Automotive and Motorcycle Inspection Field. CNAS: Beijing, China, 2018.
- Zhang, F.; Li, A.; Yu, J. Uncertainty evaluation of NOx emission measurement results in the WHTC test of vehicle engines. Small Intern. Combust. Engine Veh. Technol. 2015, 44, 18–23.
- Wei, Z.; Nong, R.; Liang, G. Research on the influence of exhaust back pressure on engine performance. Equip. Manuf. Technol. 2016, 2, 25–28.
- Qin, Y.; Teng, Y.; Qin, Q. The influence of pressure difference before and after intercooling on the performance test results of construction machinery engines. Constr. Mach. Technol. Manag. 2020, 33, 65–67.
- Cheng, W.; Huang, R.; Dai, C.; Gu, S. Experimental study on the influence of natural gas composition on engine performance and emissions. Intern. Combust. Engine Eng. 2005, 26, 24–26.